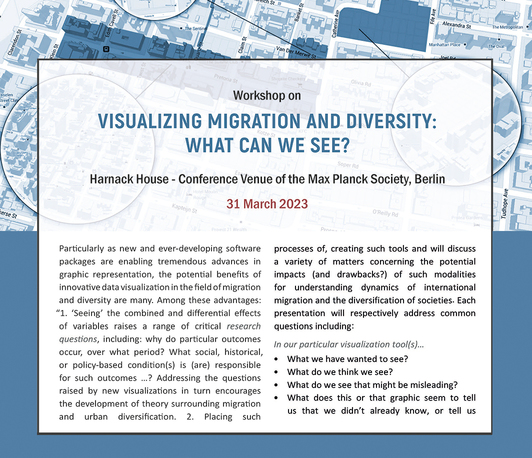
"Visualizing Migration and Diversity: What can we see?"
Workshops, conferences 2023
- Date: Mar 31, 2023
- Location: Harnack House Berlin

For more details please contact adomeit@mmg.mpg.de.
Particularly
as new and ever-developing software packages are enabling tremendous advances
in graphic representation, the potential benefits of innovative data
visualization in the field of migration and diversity are many. Among these
advantages: “1. ‘Seeing’ the combined and differential effects of variables
raises a range of critical research
questions, including: why do particular outcomes occur, over what period? What
social, historical, or policy-based condition(s) is (are) responsible for such
outcomes …? Addressing the questions raised by new visualizations in turn
encourages the development of theory surrounding migration and urban
diversification. 2. Placing such visualizations side-by-side enables new methods
for understanding through comparison.
…3. By rendering detailed and multifaceted data into quickly grasped formats, a wider, non-academic audience can gain
a better appreciation of a range of diversification outcomes – especially modes
of inequality” (*Vertovec et al. 2022: 17). Valuable contributions to teaching,
at a range of levels, and to policy development can be gained from good data
visualizations as well.
At this forthcoming workshop, a small group of invited participants will present recently created data visualizations surrounding migration and diversity. We will learn of their reasons for, and processes of, creating such tools and will discuss a variety of matters concerning the potential impacts (and drawbacks?) of such modalities for understanding dynamics of international migration and the diversification of societies. Each presentation will respectively address common questions including:
In our particular visualization tool(s)…
- What we have wanted to see?
- What do we think we see?
- What do we see that might be misleading?
- What does this or that graphic seem to tell us that we didn’t already know, or tell us better than how we have earlier grasped or understood the phenomenon)?
- What are our limitations (in data, graphics & IT, understanding, etc.)?
- What would we like to see along these lines in the future?
- What remains to be done theoretically, following such visualizations?
By the end of the workshop, participants will learn much about the topic broadly as well as come away with ideas and advice on what they might do to further the development and write-up of own their visualization tools. Comparative and cooperative projects are anticipated to ensue, too.