Data Visualization
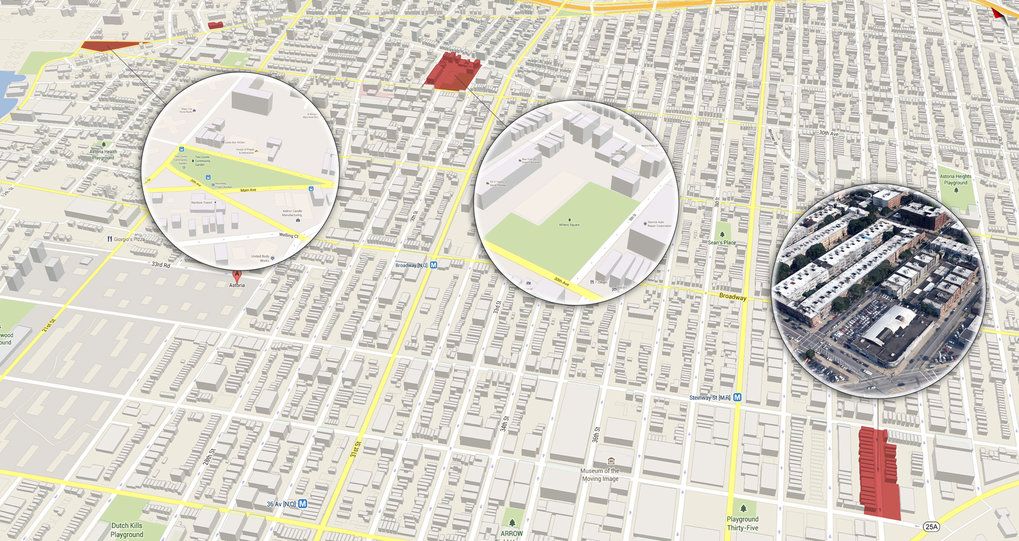
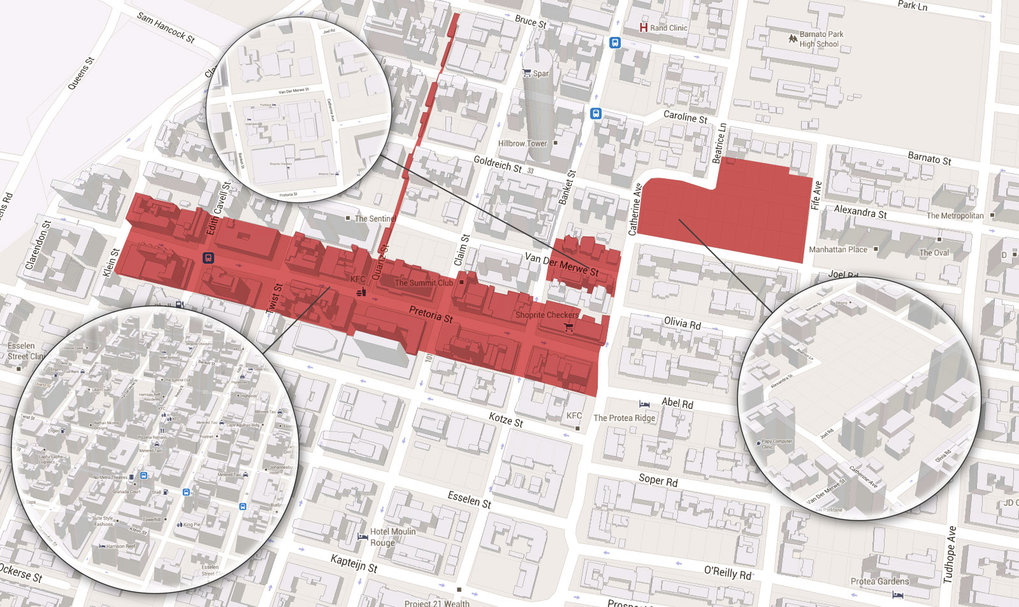
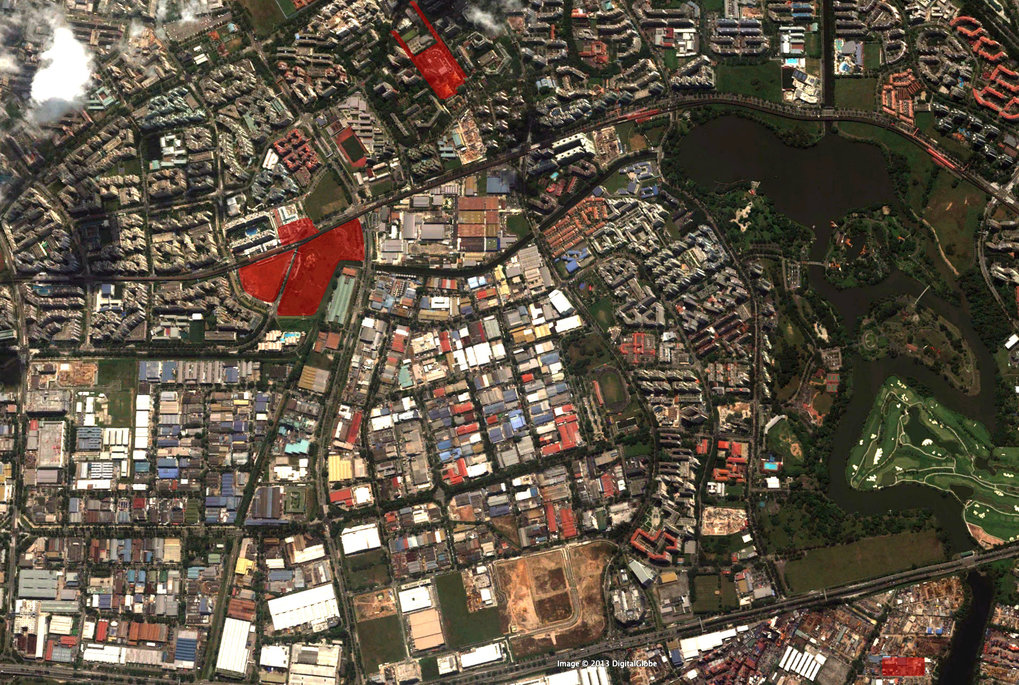
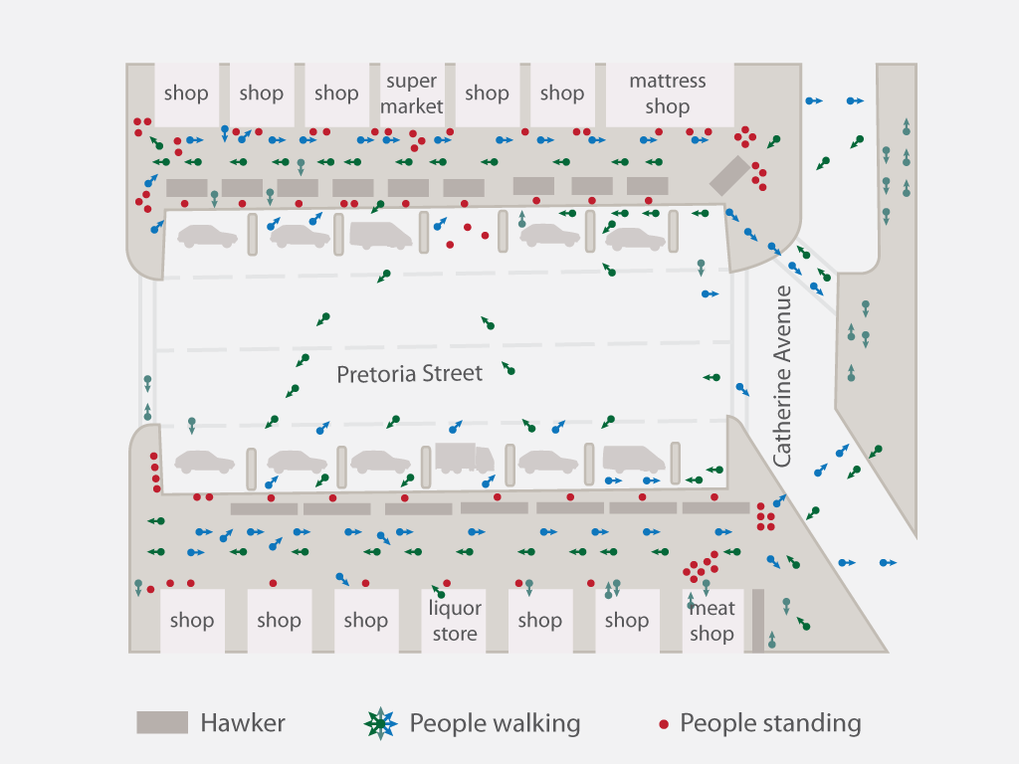
In the GLOBALDIVERCITIES project, the notion of ‘visualization’ is used in two senses. The first concerns creating, gathering and documenting visual material; the second refers to making data visible in new and compelling ways. Both will be combined for the purposes of better description, presentation and, importantly, analysis. The latter purpose is based on the premise that often, by being able to see data and its relations (importantly, for instance, in spatial terms), one is able to notice regularities and anomalies unrecognizable with other methods.